Throughout this workshop, you’ve gained hands-on experience with Sentry’s error monitoring and debugging capabilities for mobile applications. Let’s recap what we’ve learned:
1. Tuning Alerts in Sentry
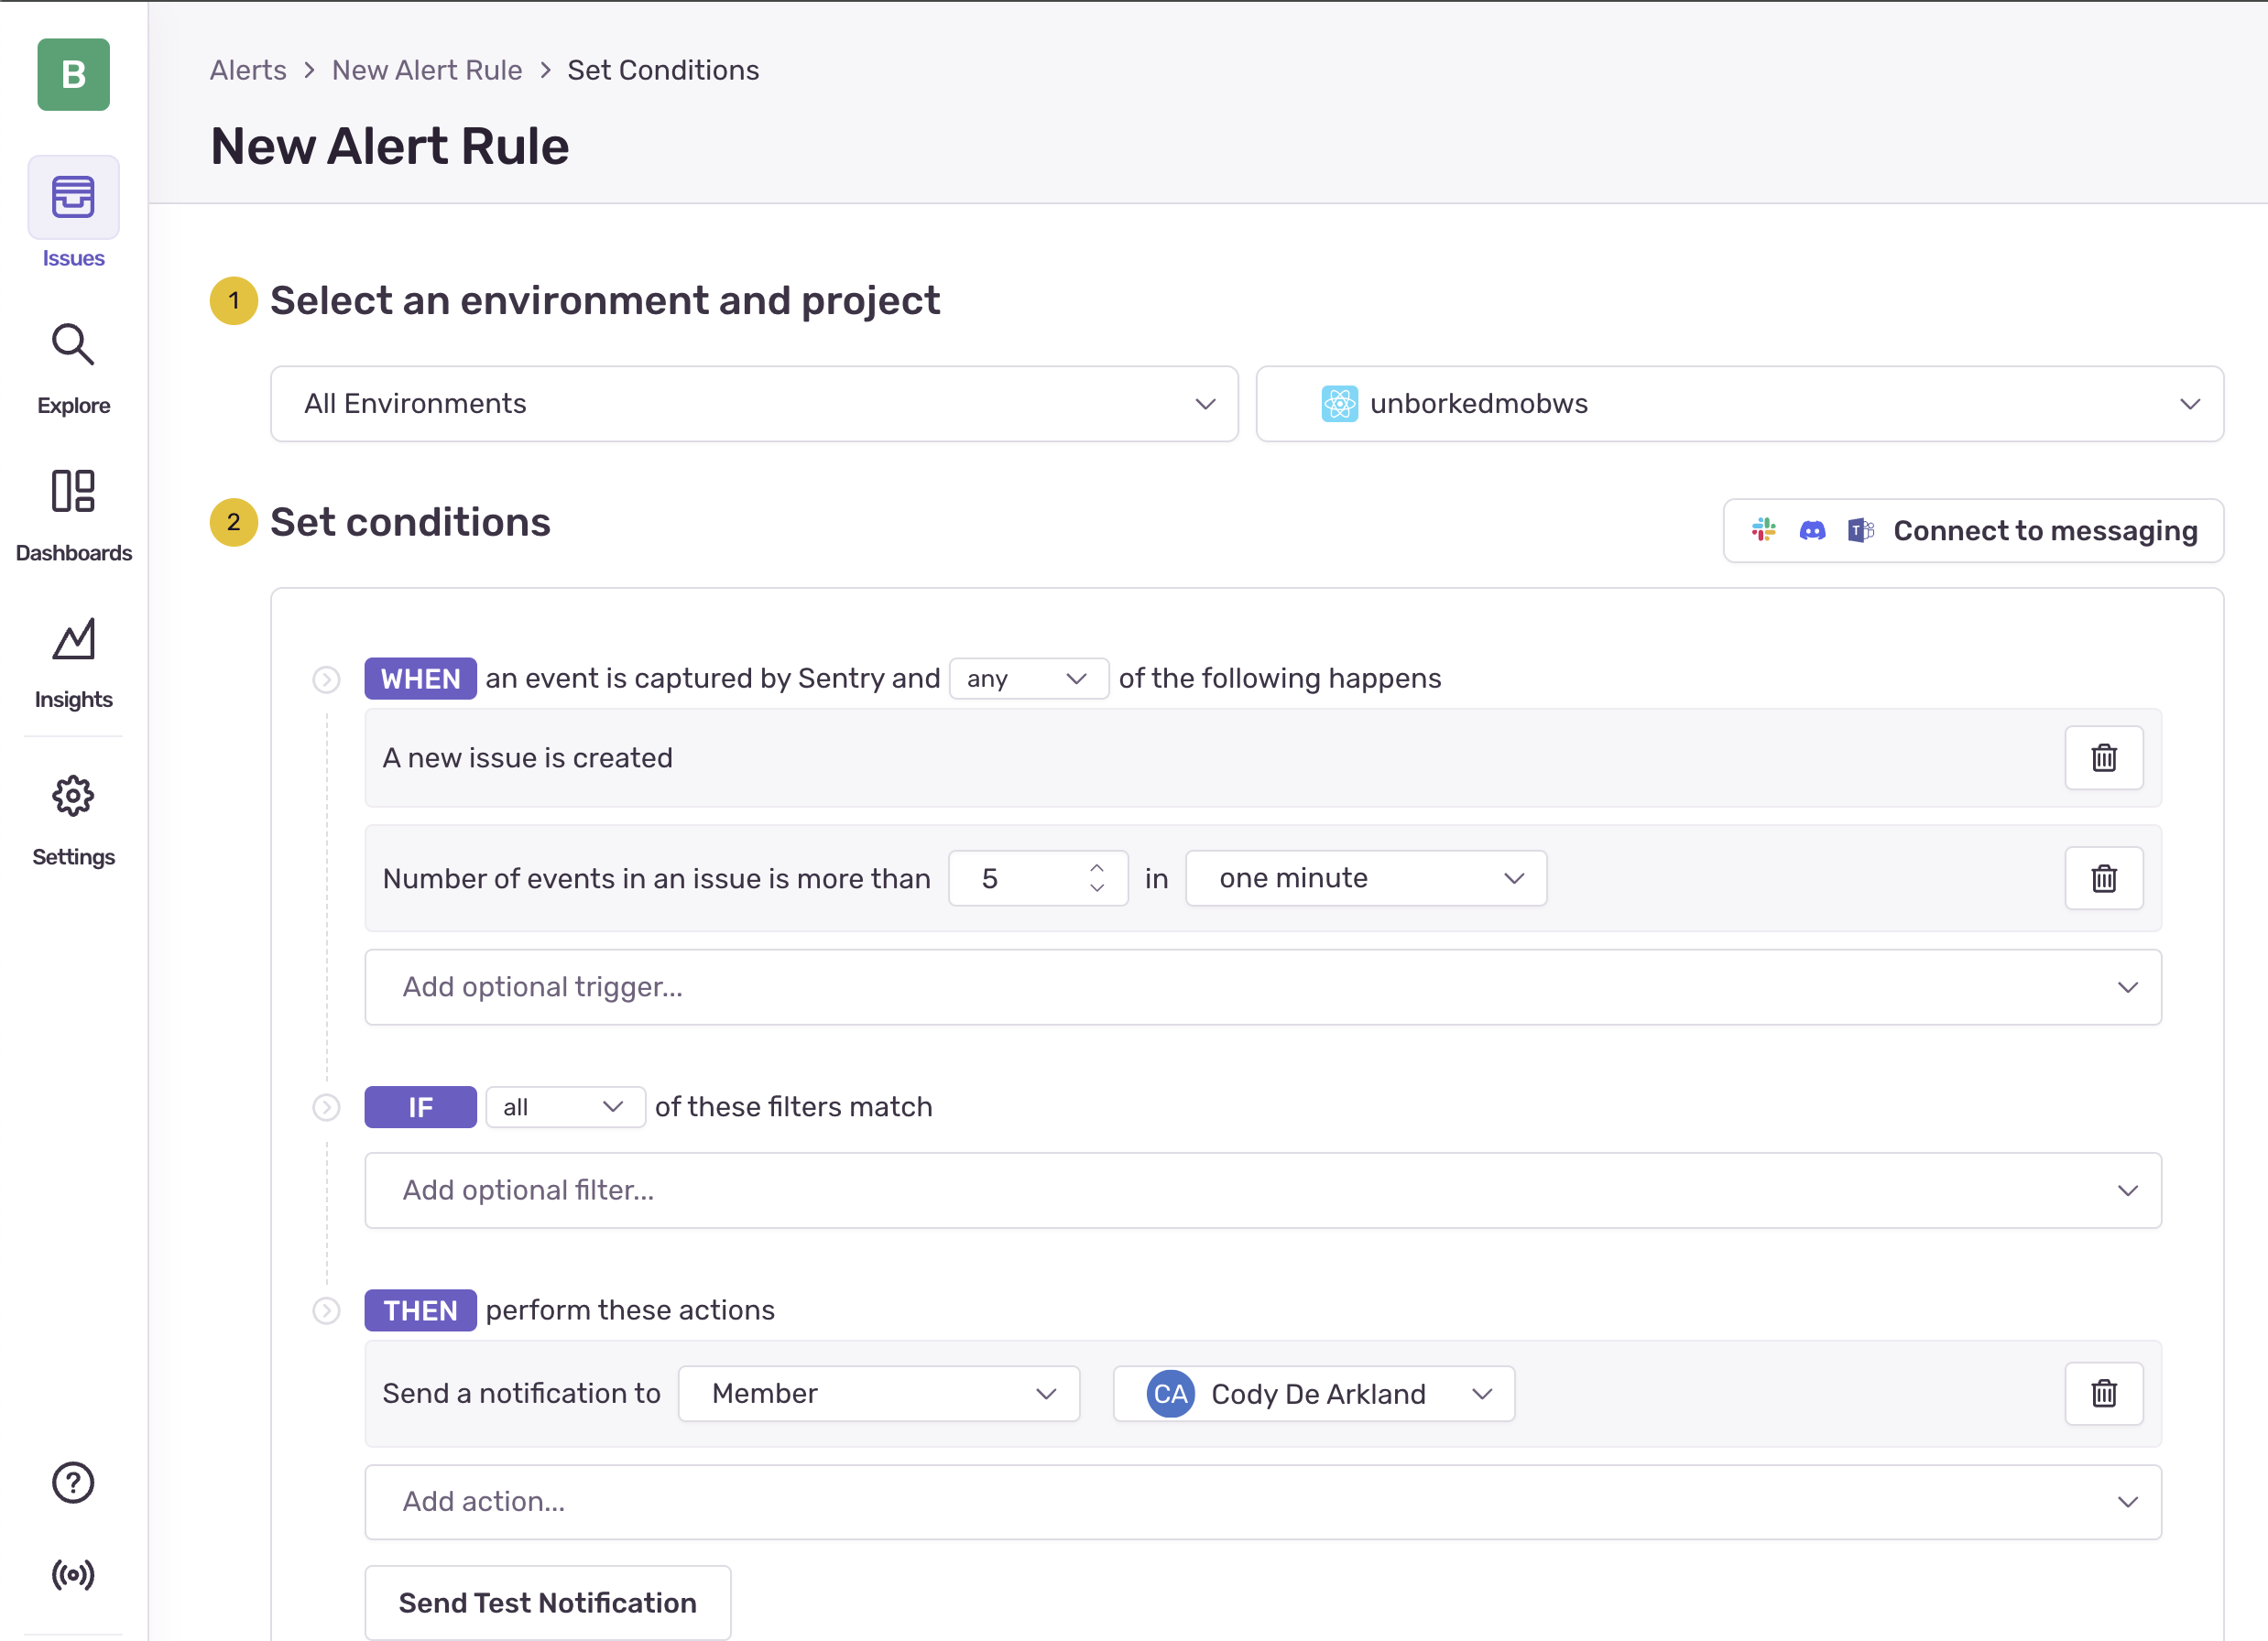
We started by understanding how to configure Sentry alerts effectively to avoid alert fatigue and ensure you get notified about issues that truly matter. You learned:
How to set up volume-based alert rules to trigger based on error frequency
The importance of adjusting alert thresholds to reduce noise
Different alert types available in Sentry, from issue alerts to performance and anomaly detection
Alert Configuration
2. Debugging SSO with Sentry Issues
In our first debugging exercise, we tackled a broken Single Sign-On (SSO) functionality:
You explored Sentry’s comprehensive issue details, including user impact and device information
You learned how stack traces help pinpoint exactly where in the code an error occurs
You experienced how mobile replays provide insight into the user’s perspective when errors happen
You successfully identified and fixed a missing password parameter in the authentication flow
Successfully fixed the SSO authentication issue
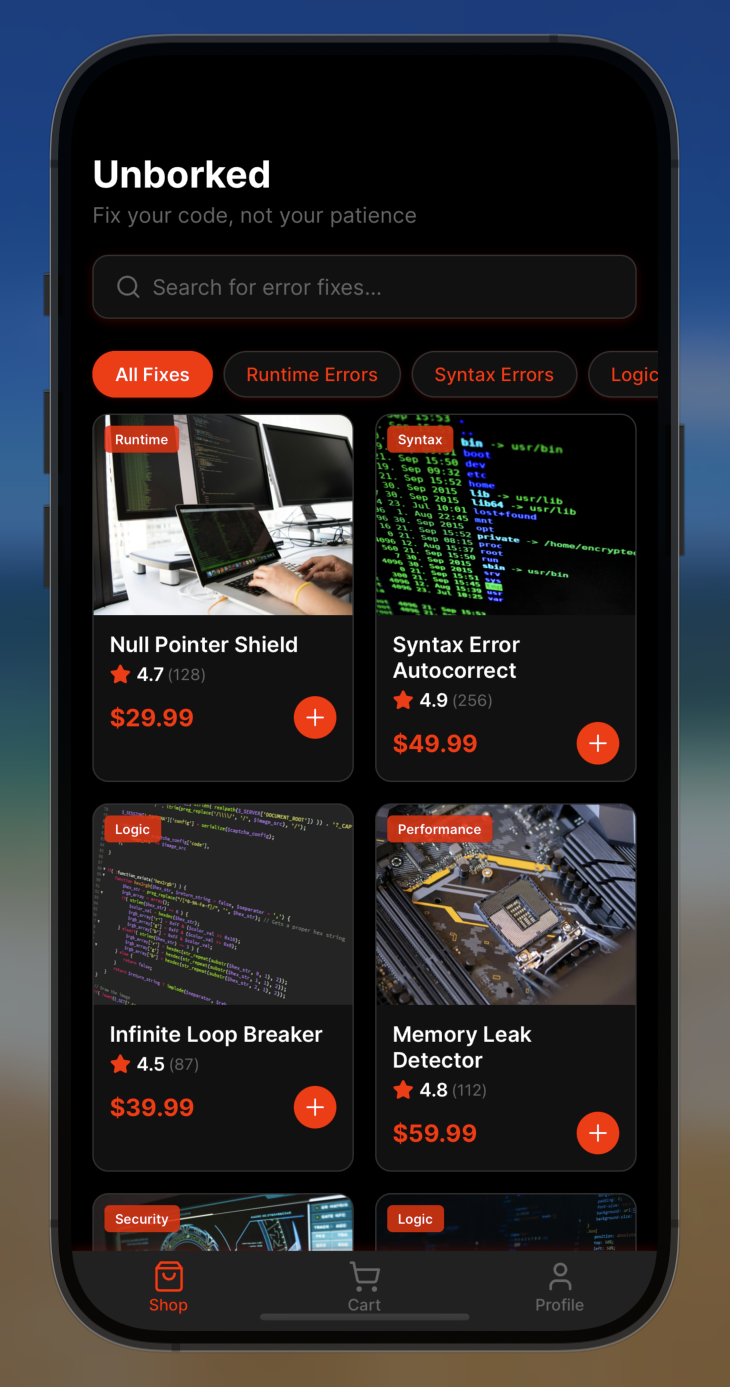
3. Troubleshooting Cart Functionality with Tracing
Next, we addressed a cart functionality issue using Sentry’s powerful tracing capabilities:
You implemented tracing to visualize the complete data flow across components
You learned how to add span attributes to capture critical context at each step
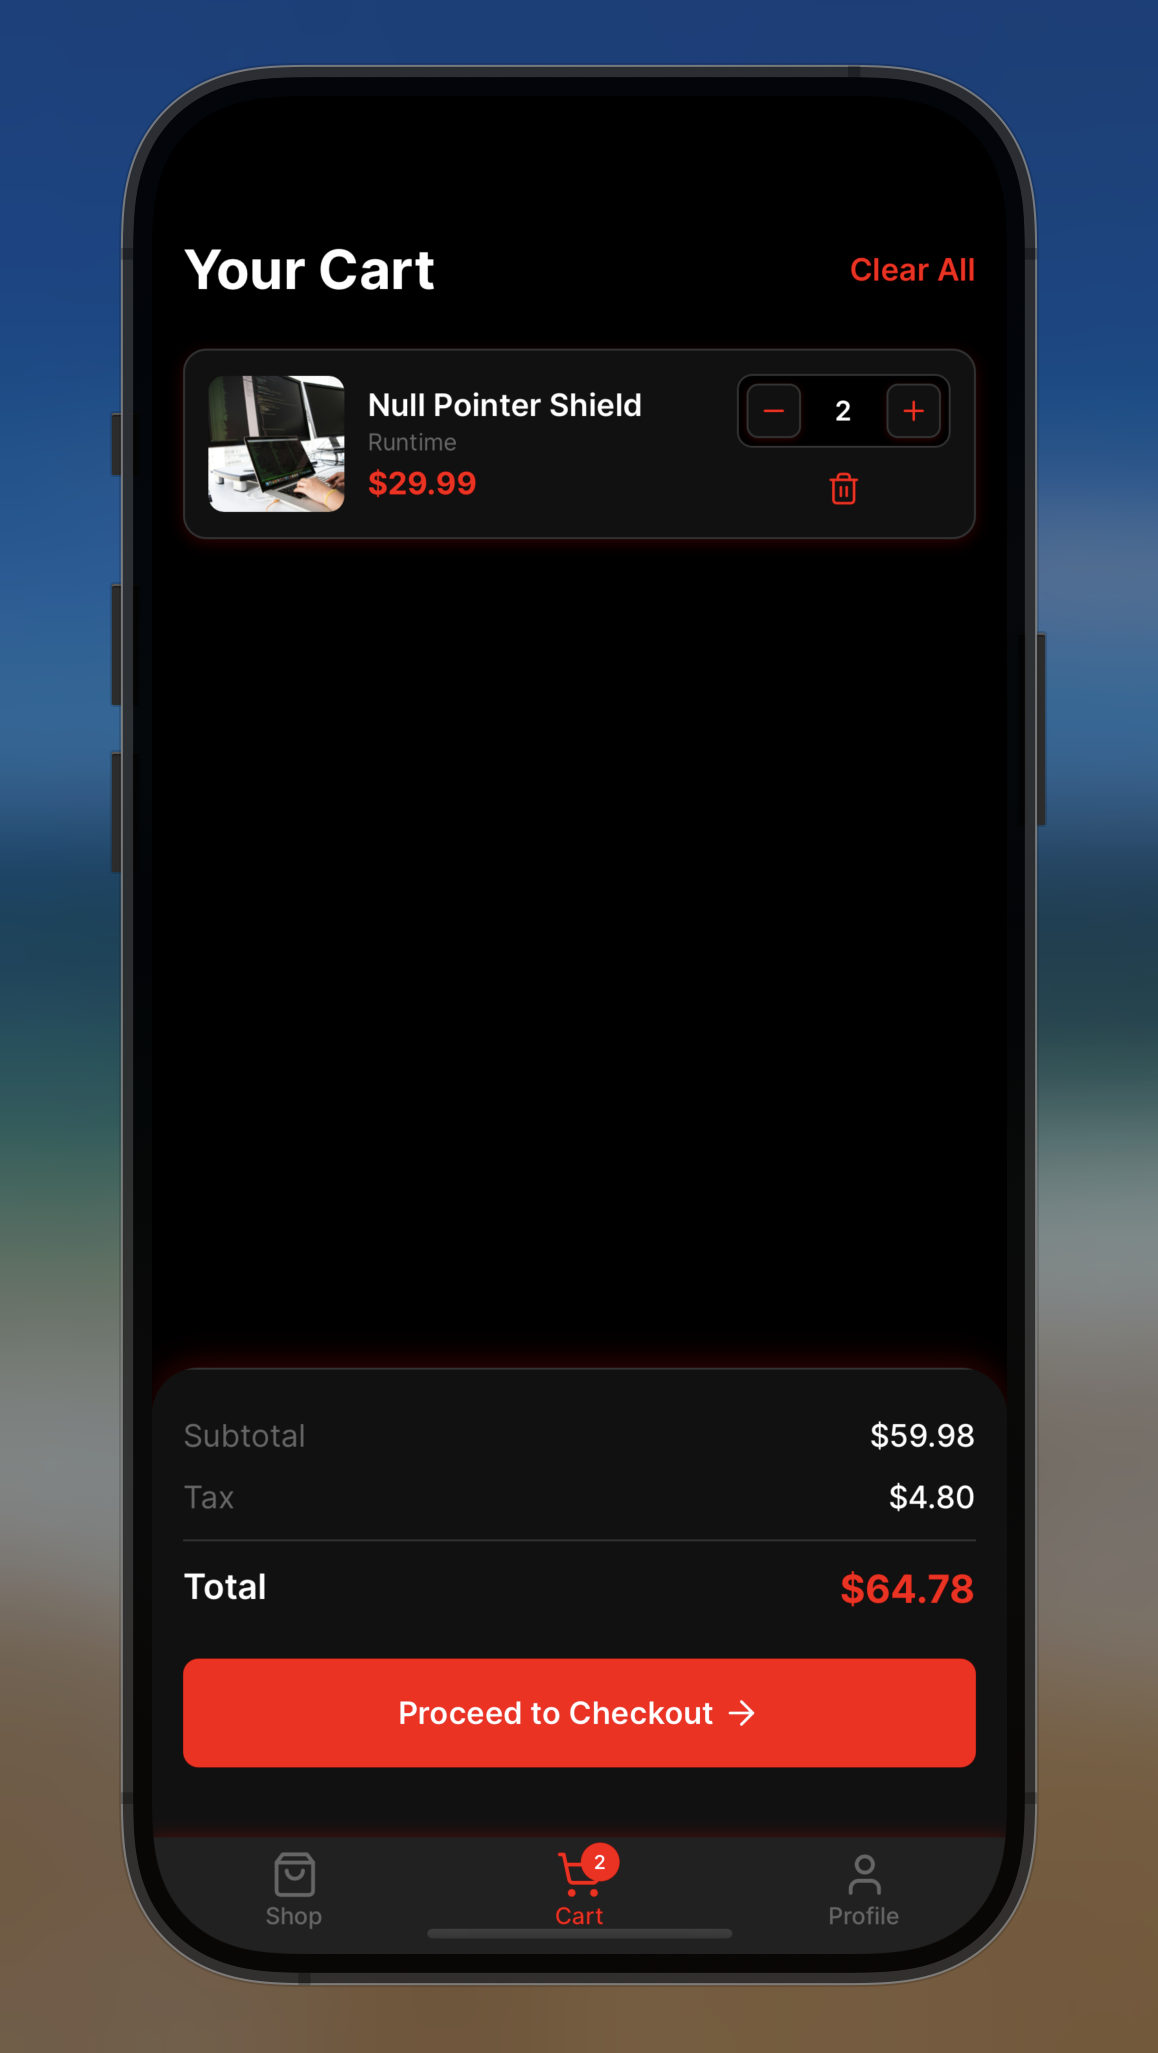
You analyzed trace data to identify that products were missing required SKU properties
You fixed the issue by properly preparing products before adding them to the cart
Successfully fixed the cart functionality
4. Debugging Checkout with Tracing
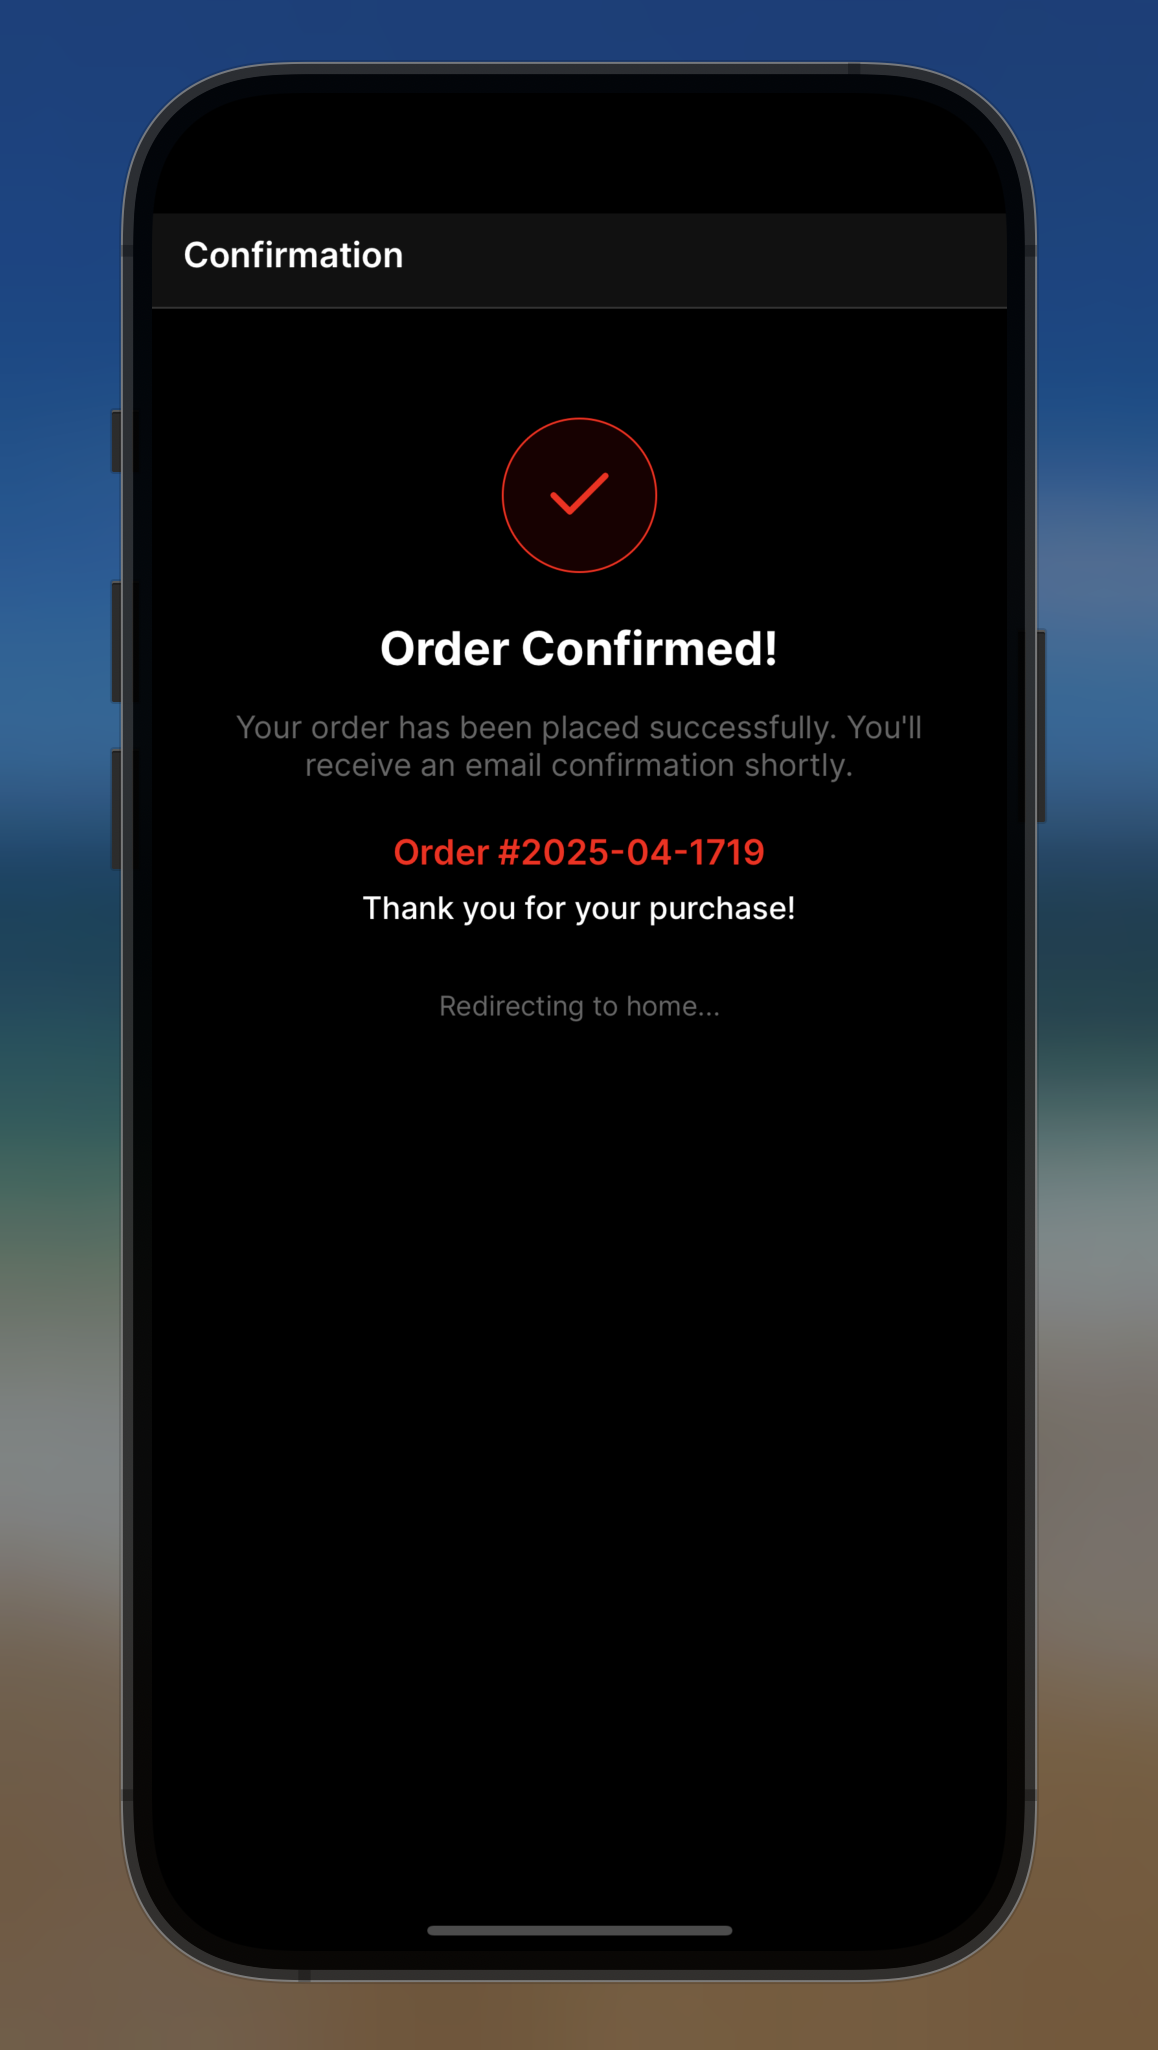
In our final exercise, you tackled a payment processing issue with Apple Pay:
You implemented comprehensive tracing across the entire payment flow
You discovered how to examine trace hierarchies and attributes to understand complex processes
You identified that although address data was being fetched, it wasn’t being properly used
You fixed the Apple Pay payment process by ensuring address data was properly incorporated
Successfully completed payment with Apple Pay
Key Takeaways
Through these practical debugging scenarios, you’ve mastered several essential Sentry skills:
Issue Identification: Using Sentry to quickly identify and prioritize critical issues
Context Gathering: Leveraging stack traces, device info, and user impact data to understand problems
Visual Debugging: Using mobile replays to see exactly what users experienced
Data Flow Visualization: Implementing tracing to understand complex interactions between components
Attribute Tracking: Adding span attributes to provide critical context at each step
Systematic Debugging: Using a methodical approach to identify, analyze, and fix issues
What’s Next?
Sentry offers many more features beyond what we’ve covered in this workshop. Here are some areas you might want to explore next: